Profiling Web Performance in Browser Dev Tools

Overview of the Performance Panel in Chromium-based Browsers
The performance tab gives us the ability to record and capture information about the performance when loading or running a page in the browser. We developers can use this in a variety of ways to diganose performance issues related to our apps, find expensive operations that are slowing our sites down, and get an overall picture of what improvements might benefit our front ends to give users a smoother experience.
Here are some example scenarios where you may want to use the Performance panel to diagnose an issue:
- UI/CSS transitions and animations appear jittery/delayed
- re-rendering the rows of a table is slow when sorting
- a calculation in front end JavaScript takes an unexpectedly long time
At first glance, there seems to be a lot going on within it, but it’s not as bad as it looks! The entire performance panel is organized into a series of horizontal tracks. We can parse through the tracks to focus on specific points of time in a recording.
Here are the different areas of the panel:
Header Bar

The header bar of the panel contains:
Record,Start profiling and reload page, andClearbuttons: these control the entirety of what we record and analyze within the performance panel.- In recent versions, we have buttons to load/save profiles into JSON format.
- The
ScreenshotsandMemorycheckboxes, which give us the option to include these into the recorded performance profile if we want to analyze them. - And a broom-icon garbage collection button for cleaning up.
Timeline Track
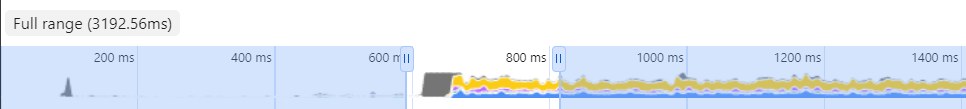
The very first track shows an overall graph of the activity during a recording. We can use the handles or simply click and drag to select a segment of the timeline to analyze it in more detail.
Navigating the Timeline
You can use the W, A, S, D keys to navigate the performance panel timeline.
W/S:: zoom in and zoom out from the current view of the timelineA/D:: shift the view on the timeline left and right
Frames Track
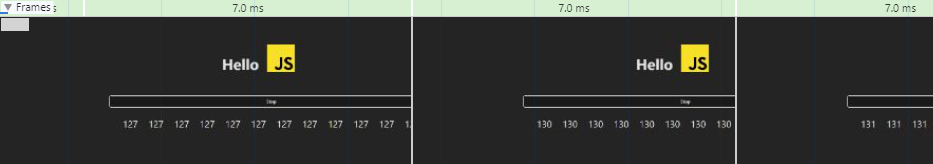
Shows frames of the screen when something changes and the browser renders an update. You can find where frames drop and look into the surrounding factors to determine what is causing the performance to suffer.
Animations Track
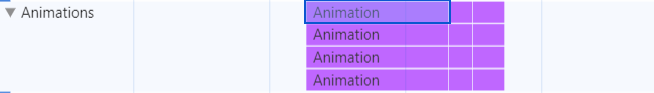
For viewing simple analytics data related to animations performed on the page.
Main Track
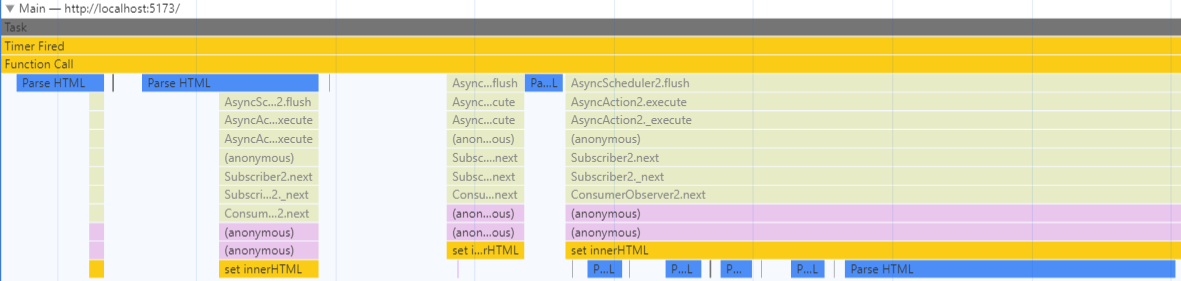
Displays activity that happens on the main thread. This is the central track and will likely be the track you spend the most time reviewing for typical use cases.
Bottom Panel
At the bottom (by default), you will see a few tabs that give you in-depth detail on whichever part of the recording you are currently analyzing.
An Example with RxJS
If you are interested in trying this out yourself, I have published an example project on GitHub using Vite and RxJS.
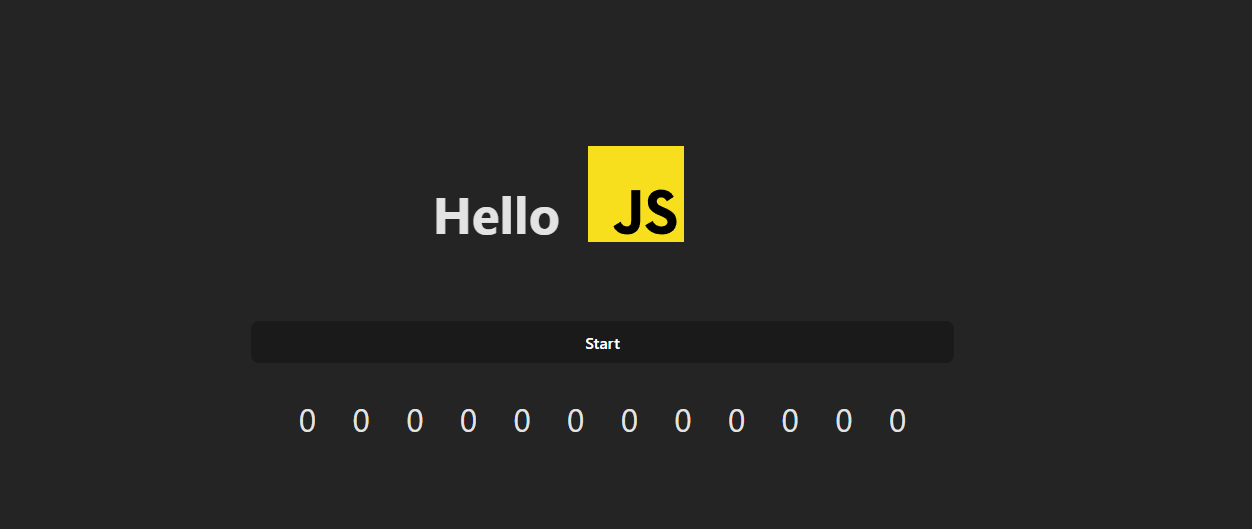 Here we use RxJS observables to test multiple elements being updated by the browser every 1 millisecond.[1]
Here is the click event handler that is set up to trigger a rapid update of counter values for all 12 counter elements (marked with class "counter")
main.jsimport { Subject, interval, takeUntil } from 'rxjs';
export const setUpPerfTest = (elm, counters) => {
elm.innerHTML = 'Start';
// 'Start' handler
elm.addEventListener('click', () => {
elm.innerHTML = 'Stop';
const stop$ = new Subject();
// Update all counters every 1 time unit (usually milliseconds)
interval(1)
.pipe(takeUntil(stop$))
.subscribe(
val => counters.forEach(
ctr => ctr.innerHTML = val
)
);
// 'Stop' handler
elm.addEventListener('click', () => {
stop$.next();
// Reset 'Start' handler
setUpPerfTest(elm, counters);
}, { once: true });
}, { once: true });
}
Recording a Profile
To record a profile, click record, activate page code to make the browser perform computations, and then stop the recording.
Analyzing a DOM Event
Below, we can see a small amount of information on our click event (Pointer event) and its timings when locating it on the Interactions track.
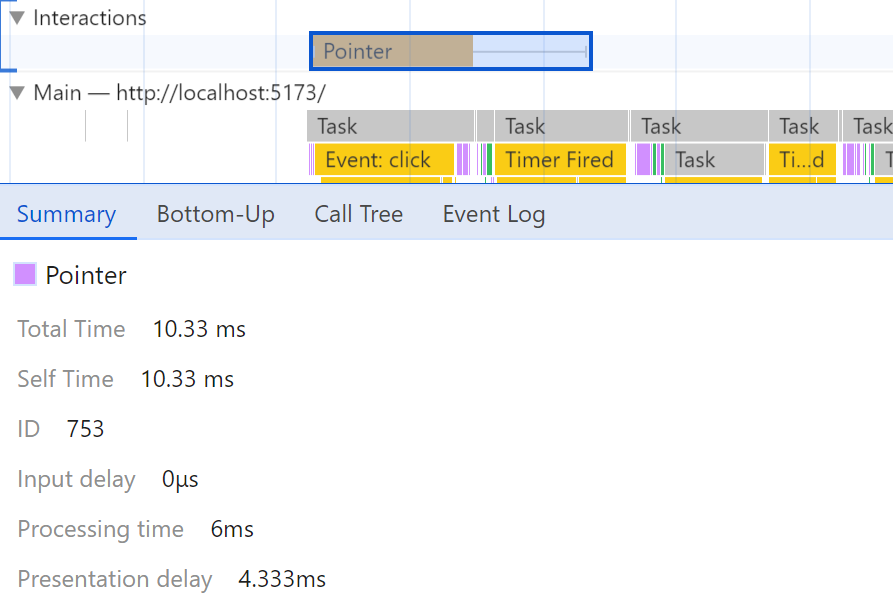
For more in-depth information, we can zoom into where activity picks up on the main thread (by using the Main track) and we locate the click handler function,
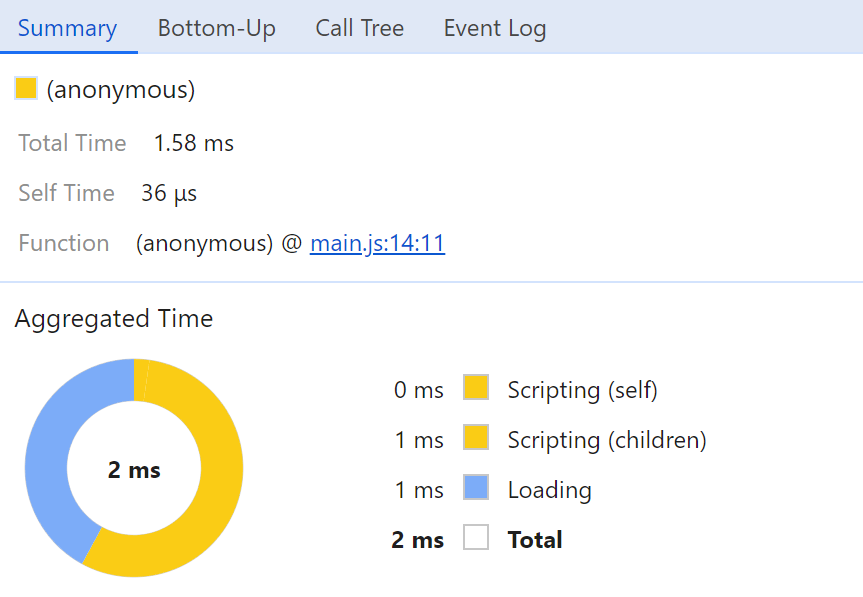
which is defined anonymously in our main.js code above. We are able to see it under the label “(anonymous)”.
In Bottom Panel > Bottom Up or Bottom Panel > Event Log, we can see the entire call stack’s function
cascade of how we get from Click event to our own code. Bottom up will show you from the top
of the stack all the way to the origin of the execution cascade.
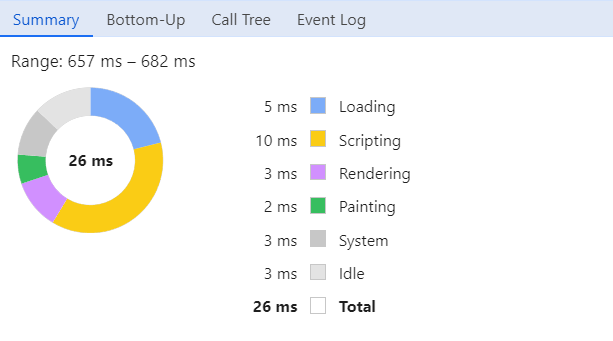
The Summary tab shows us information on the specific call like its total runtime,
a distribution chart of the runtime between load time, self runtime, and runtime
of child function calls.
Closing Thoughts
Although there is no specific performance bottleneck we need to diagnose here, I hope this overview of how the performance panel can prove useful for devs who need more insights on troubleshooting front end performance and render issues apps.
Footnotes
- [1] Note: not true milliseconds, it is dependent on the scheduler.